
Gabriel Alves da Costa Lima
Diretor da Aremas
OpCP72
O desafio da alocação capex para reinvestimentos
O retorno econômico de operação dos ativos (ROA) em cada ano é expresso por meio de:
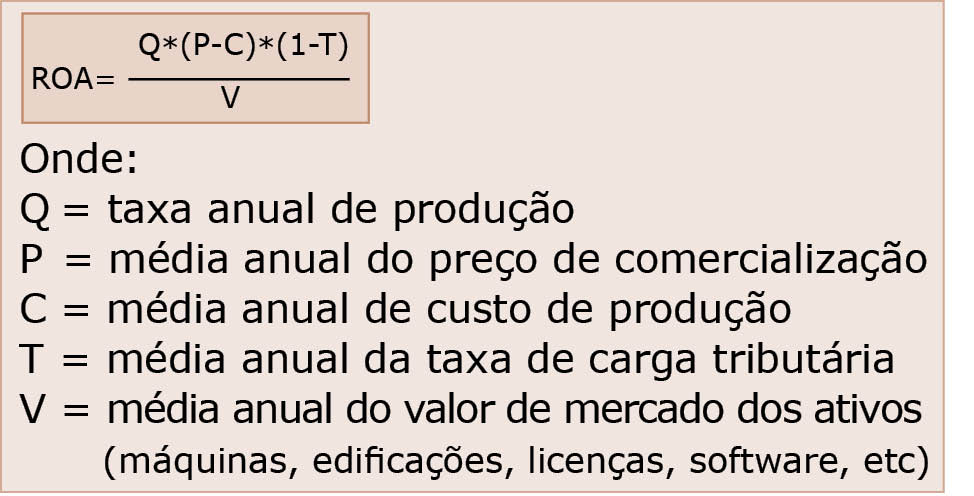
Esta equação deve estar na mente de todos os gestores, sejam eles de manutenção, de produção, de marketing etc. Ela está na mente do CEO e analistas de mercado. Mas, por quê? Simples, ela é o motivador de qualquer movimento de gestão de ativos de sua empresa. A empresa possui pouco controle em mercado aberto. Não se controla a produção, mas sim o mercado; não se controla o preço, mas sim o mercado; não se controla o valor de revenda dos ativos, mas sim o mercado; não se controla os tributos, mas sim o congresso. Portanto, a empresa controla apenas o custo de produção. No dia a dia, é comum ouvir frases como estas: “Este equipamento está falhando demais”; “Este equipamento consume muita energia, tem muitos vazamentos”; “O custo deste equipamento é o mais alto de toda a frota”. Isto nos faz lembrar do conceito de vida econômica dos ativos (ah, em tempo: trator não tem vida útil, mas sim econômica; o rolamento do motor do trator é que possui vida útil).
Todo ativo possui vida econômica, seja empregado na produção ou no processamento de madeira. Ela é o intervalo de tempo de operação que minimiza seu o custo total de propriedade (uso). Vamos apresentar 2 situações diferentes (mas complementares) de gestão de ativos: (1) Substituição de ativos individualmente e (2) Substituição de ativos dentro do sistema.
1. Substituição de ativos individualmente:
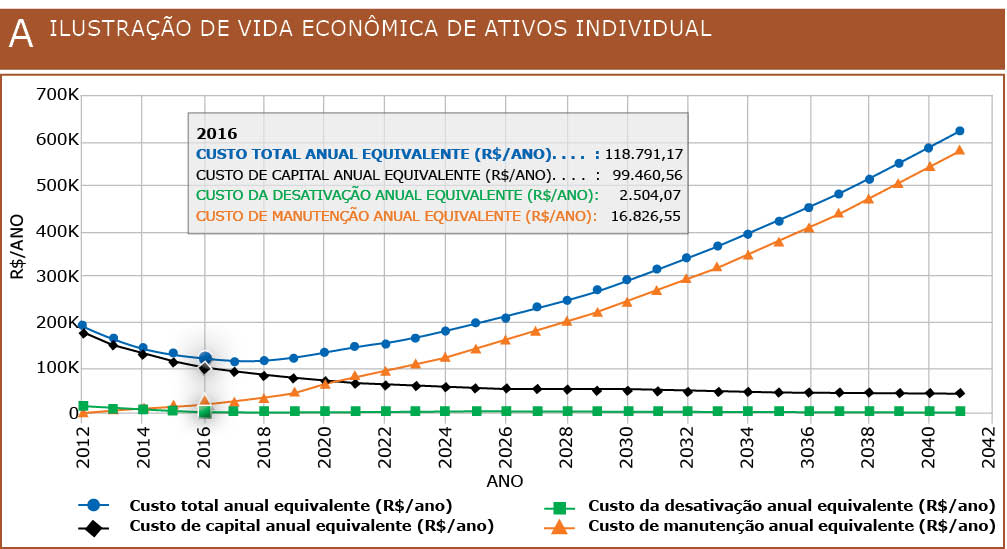
Esse tipo de gestão consiste em fazer uma análise em nível individual de ativos (trator, forwarder, caminhão, motor etc.) em função do custo de aquisição, custo de manutenção, custo de oportunidade de capital, regras de depreciação fiscal e dentre outras. A partir destes inputs pode-se estimar a vida econômica como mostrada na Ilustração A. A vida econômica é 6 anos de modo que o custo de propriedade é minimizado. Mas, qual o valor gerencial desta substituição a cada 6 anos? Para explicar, consideremos que existam 2 opções de substituição: a cada 6 anos ou a cada 12 anos.
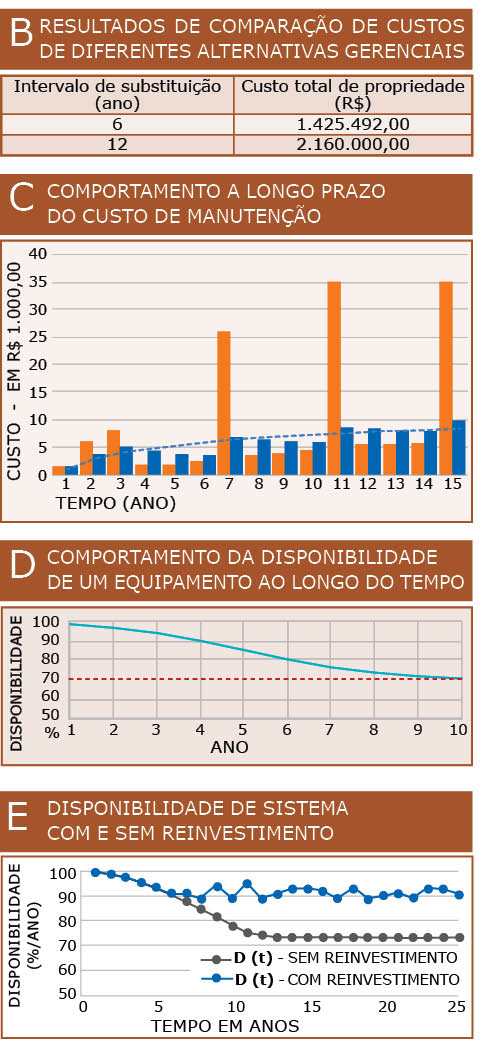
A ilustração B mostra os resultados de comparação de custo de diferentes alternativas gerenciais. Nota-se que a substituição no momento correto possui um valor gerencial de R$ 734 mil. Isto é o que se chama hoje de transformação gerencial a partir de grandes bases de dados. Há muito espaço para otimização de recursos e controle dos custos (única variável gerenciável para gerar retorno sobre os ativos). Esse resultado foi para um equipamento. Pense no ganho da aplicação desse modelo em todos os ativos.
2. Substituição de ativos dentro de sistemas de produção:
A produção de celulose só acontece se, e somente se, ocorrer o funcionamento de todos os ativos do sistema (subsistema picador, subsistema digestor, subsistema caldeiras, subsistema depuradores, subsistema branqueamento etc.). Ou seja, é a disponibilidade do sistema integrado que interessa, e não dos subsistemas isolados. Com isso, surgem as perguntas:
A produção de celulose só acontece se, e somente se, ocorrer o funcionamento de todos os ativos do sistema (subsistema picador, subsistema digestor, subsistema caldeiras, subsistema depuradores, subsistema branqueamento etc.). Ou seja, é a disponibilidade do sistema integrado que interessa, e não dos subsistemas isolados. Com isso, surgem as perguntas:
• Em quais ativos devemos alocar investimentos em reformas neste ano e no próximo?
• Qual o montante mínimo de reinvestimento de modo que o sistema tenha uma disponibilidade de 92% nos próximos 5 anos?
• Atualmente, há dois motores com baixa performance, mas qual deles deve-se substituir imediatamente uma vez que o orçamento é limitado?
Ao se medir os custos de manutenção de cada subsistema (ou equipamentos) ao longo do tempo, tem-se um comportamento semelhante ao mostrado na ilustração C.
Nota-se que os custos de manutenção em cada ano são incertos. Já a curva de custo equivalente ao longo do tempo é sempre crescente, mas com velocidade cada vez menor. Por outro lado, à medida que se acumula tempo de operação, tem-se uma redução da disponibilidade do ativo como mostrado na ilustração D.
A ilustração D mostra que, à medida que se acumula tempo, a disponibilidade do equipamento diminui e estabiliza devido aos serviços constantes de manutenção. Mas, o que ocorre com a disponibilidade na planta?
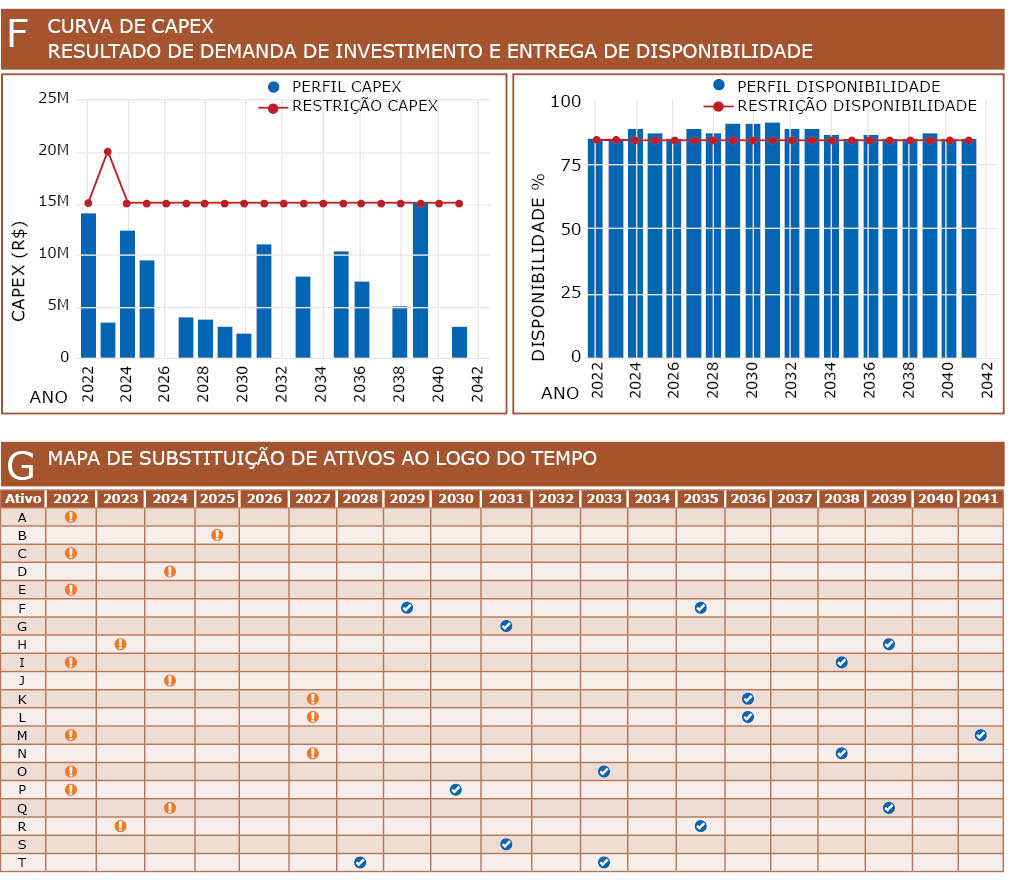
Ao se realizar a substituição dos ativos, ocorre uma renovação da sua disponibilidade como demonstra a ilustração E. Nota-se que sem os reinvestimentos, a disponibilidade anual da planta diminui para se estabilizar em torno de 73%. Mas, à medida que se faz reinvestimentos, ocorre uma recuperação de disponibilidade da planta para o nível desejado. Considere um caso de uma planta contendo 20 ativos. A empresa possui uma meta de investimento de 15 milhões/ano exceto em 2023 que será 20 milhões/ano. Há uma meta de 85% de disponibilidade em cada ano. O gerente deseja saber quais ativos devem ser substituídos e quando. A solução encontra-se na ilustração F.
A flexibilidade gerencial para gerar os resultados mostrados na ilustração F consiste na escolha de quais ativos deve-se fazer investimento e em quais anos efetivá-lo. Isto é mostrado na ilustração G. Note que nela os ativos A e B devem ser substituídos em 2022, o ativo C deve receber reinvestimento em 2026 e assim por diante. Aqueles ativos que devem ser substituídos mais cedo são mostrados na cor laranja e aqueles com mais tempo de sobrevida econômica são mostrados em azul. Esta abordagem é fundamental para o planejamento estratégico (PE). No entanto, sem o uso de análise de dados, modelagem econométrica e aplicativos computacionais não é possível na prática.